

13 Jun Market Commentary: The Market’s Bad Breath
Halfway through 2023, we have seen an unexpectedly calm market environment. The CBOE Volatility Index (VIX) is a commonly used gauge of market distress where values below 20 indicate calm conditions. During times of higher volatility, such as the Great Financial Crisis in 2008 and pandemic selloff in 2020, the VIX skyrocketed north of 80. Currently, the VIX rests below 15. Technology names, which were the S&P 500’s worst performing sector in 2022, have led the rally this year. The majority of the S&P 500’s return in 2023 has been generated by just seven names: Apple, Microsoft, Amazon, Alphabet, Nvidia, Tesla, and Meta. The top 10 companies are responsible for over 90% of the index’ returns this year, which is the highest in history.
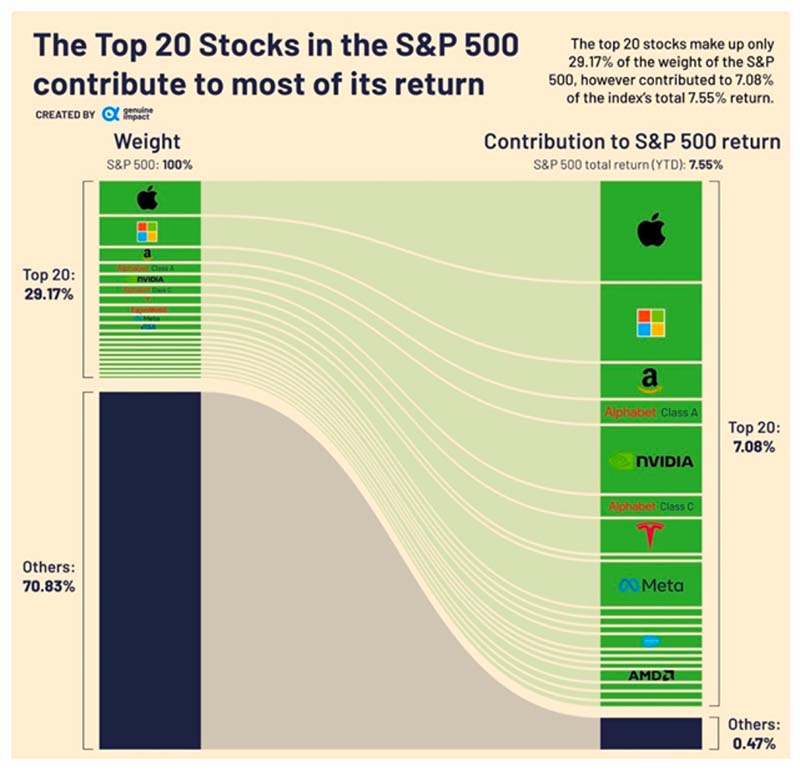
A market’s “breadth” is measured by several indicators, but the general idea is measuring whether more stocks are advancing versus declining. A wider market breadth resembles a growth market that is more sustainable and has widespread momentum across most business sectors. A narrow breadth suggests that only a few concentrated names are leading the overall market higher. Historically, a lack of participation of smaller companies (narrow breadth) has preceded market recessions. The concentration at the top makes the entire index vulnerable to large drawdowns when the top names regress to the mean. The current market breadth of the S&P 500 measures in the 99th percentile since 2010. Its top 20 companies make up ~30% of the market capitalization of the entire index. To put this lopsided weight into perspective, Apple (which is currently approaching a $3 trillion market cap) is larger than the entire Russell 2000 (an index of small cap companies).
So why has this happened? Some suggest that these big names are retracing from their losses in 2022. These market- leading behemoths are incredibly profitable cash flow generators. The rush into companies that have exposure to AI has also contributed to speculative upward movement. The deteriorating economic environment suggests that smaller, lower-margin businesses may have a hard time keeping up in a slower-growth environment. There has also been competition for an investor’s portfolio, as money markets are yielding close to 5% while also eliminating equity market risk.
Wall Street analysts have fallen into two camps: One side of strategists is suggesting that megacaps will regress to the mean and lead the way down as they struggle in a slower growth environment, causing the index to draw down substantially. The other side is prophesying that megacaps will pull up the rest of the market and that the Fed’s actions are not as restrictive to businesses as investors fear.
The market has been eerily calm. Fundamentals have been deteriorating. We continue to recommend that investors stay defensive in this environment, dollar-cost average new funds for investment into portfolios, and take advantage of opportunistic dips as volatility comes back into markets.
As always, please do not hesitate to reach out to your financial advisor with any questions or concerns.
The Seventy2 Capital Team
Commentary and Research provided by:
Michael Levitsky, CFA®, CAIA® – Director of Investment Strategy
The CBOE Volatility Index® (VIX®) shows the market’s expectation of 30-day volatility. It is constructed using the implied volatilities of a wide range of S&P 500 index options. This volatility is meant to be forward looking and is calculated from both calls and puts. The VIX is a widely used measure of market risk and is often referred to as the “investor fear gauge. The S&P 500 Index consists of 500 stocks chosen for market size, liquidity, and industry group representation. It is a market value weighted index with each stock’s weight in the Index proportionate to its market value.
PM-08072025-6378146.1.1