

Sep 24, 2026 Priced In: The Rate Hike, the AI “Slowdown,” and the Road to November
On September 16 the Federal Reserve raised interest rates for the first time since July 2023: a quarter point, to a range of 3.75% to 4.00%, on a unanimous vote. If that were all you knew, you might have expected a rough week for markets. It wasn’t. Bond yields barely moved on the announcement, and stocks finished that week close to where they began it. What has happened since is more interesting: long-term yields have climbed to their highest levels in nearly two decades, and the reason has more to do with growth than with the Fed. In this commentary we cover what the rate hike does and doesn’t change, why we think higher interest rates are not the threat they sound like, the unusual news out of the AI industry that briefly rattled technology stocks, the election now less than six weeks away, and the earnings story that we believe still matters more than any of it.
Did the rate hike change anything?
Less than the headlines suggest. Going into the meeting, futures markets put the odds of a hike above 90%, and the 10-year Treasury yield had already climbed a full percentage point from its February low, crossing 5% the week before the meeting for the first time in three years. In other words, the bond market raised rates months ago; the Fed caught up to it on the 16th. The clearest evidence is what happened next: yields barely moved on the announcement and fell the following day. When the most telegraphed rate hike in years finally arrives and the bond market shrugs, the message is that the news was already in the price. What has moved yields since then is something else entirely, and we get to it below.
We should be straightforward about our own call. In July we told you we saw very little chance of a rate increase this year. The committee saw it differently, and the late-summer data (a strong August jobs report, another hot monthly inflation reading) gave it the reason. We were wrong about the decision. What we want you to focus on is what the Fed itself said alongside it.
Chair Warsh opened his press conference by noting that the American economy “appears to be strengthening,” with hiring, private-sector earnings, and business investment all improving. The committee’s own projections, released the same afternoon, raised this year’s growth forecast to 2.3% and next year’s to 2.4%, kept unemployment at 4.1%, and showed inflation falling to 2.3% next year. And the median projection for interest rates? One more quarter-point move this year, then no change at all through 2027. Read those numbers together and the Fed is not describing a long campaign of rate increases. It is describing a strong economy, inflation it expects to keep falling, and a policy adjustment that is nearly finished by its own math.
It helps to understand which inflation number drove the decision, because two official gauges are telling different stories right now. The measure the Fed prefers, called PCE, has been stuck near 3.3% on its core reading for several months. That is the number behind the September 16 vote. The more familiar Consumer Price Index tells a better story: core CPI rose just 2.4% over the past year in August, its smallest annual increase since 2021. The chart below is one we have shown you before, updated through August. The spike this spring was energy. The dark line underneath, the one that excludes energy, barely moved through the entire episode and is now lower than when the year began.
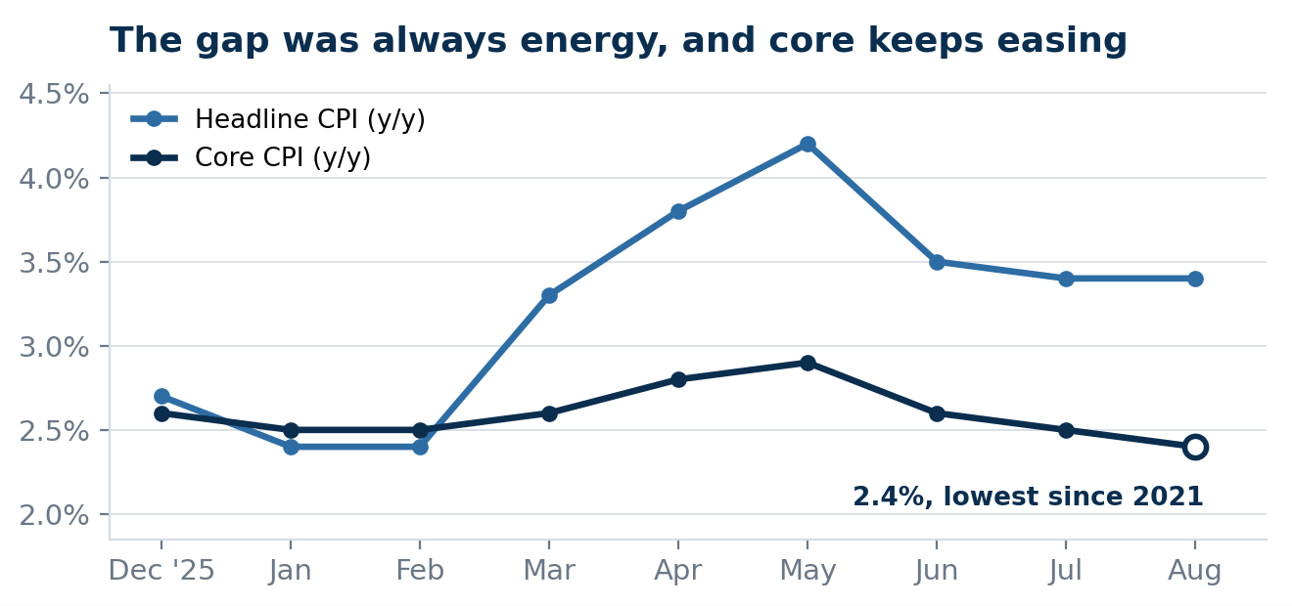
Sources: Bureau of Labor Statistics, Consumer Price Index, December 2025 – August 2026. February and March headline figures interpolated from BLS energy contributions.
Here is the harder part for bond investors: yields have kept rising since the meeting, and not because of the Fed. On Wednesday the 10-year Treasury reached 5.1%, its highest level since 2007, and the 30-year touched a level last seen in 2004. The trigger was not the central bank. It was a survey of business activity that came in at its strongest reading in more than five years, on top of firm hiring, a sharp rebound in retail sales, and the Fed’s own upgraded growth forecasts. Rates are rising because the economy is growing faster than almost anyone expected, and that is a very different situation from rates rising because inflation is out of control. We think we may be in a period of higher interest rates than the past fifteen years trained investors to expect. We also do not think that is bad news, and the history is on our side.
Since 1962, the 10-year Treasury yield has averaged 5.8%. Through the 1990s, one of the strongest decades the stock market has ever had, it averaged 6.7% while the economy grew more than 3% a year. Even in the 1960s, another strong growth decade, the 10-year averaged close to 5%. The outlier was the 2010s, when it averaged 2.4% and a generation of investors came to think of that as normal. It wasn’t. A 5% Treasury yield alongside 2% to 3% real growth is close to the long-run American average, and that combination has coincided with good decades for investors far more often than bad ones. The chart below puts today in that context.
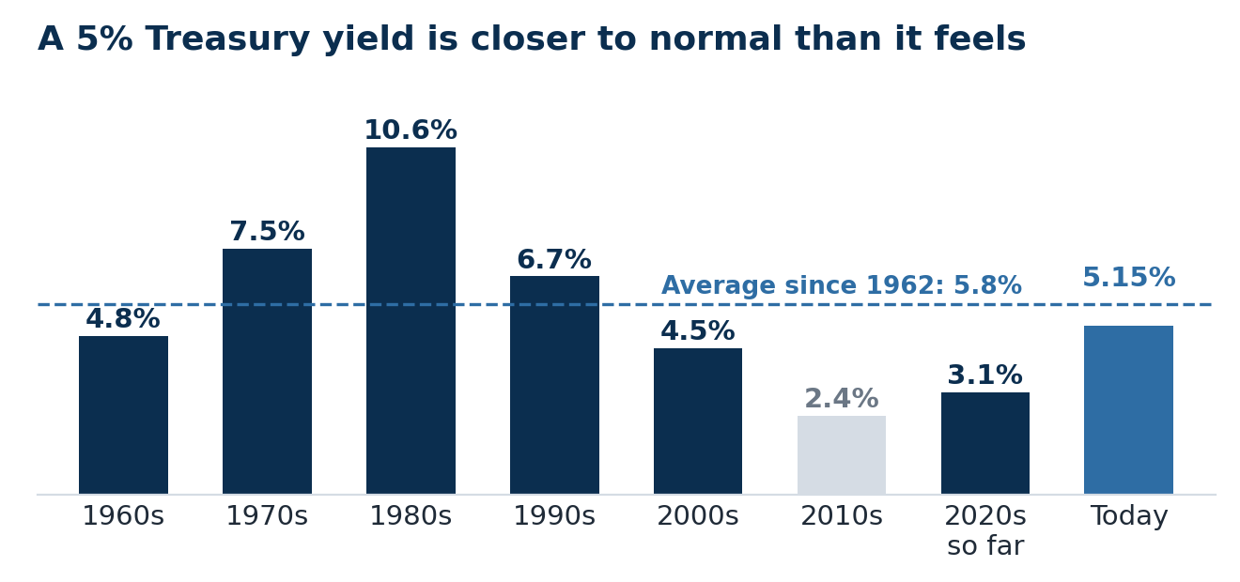
Sources: Federal Reserve Board H.15 via FRED, 10-year Treasury constant-maturity yield; decade figures are averages of daily data. Real GDP growth by decade per Bureau of Economic Analysis via FRED.
The other half of the story is that investors are finally being paid to take interest-rate risk, and paid well by historical standards. Investment-grade corporate bonds now yield about 5.7% on average, a higher yield than on roughly nine of every ten trading days since 1997. After inflation, a 10-year Treasury now pays about 2.6% a year, the highest real yield since 2008 and more than six times the average of the 2010s. Perhaps the most useful way to think about what that means for you: in the summer of 2020, yields on the broad U.S. bond market only had to rise about two-tenths of a percentage point over a year to wipe out a full year of income. By this spring that cushion was more than four times larger, about eight-tenths of a point, and it has grown further since, with the broad bond index now yielding more than 5%. Rising rates have pushed bond prices down this year, and we will not pretend otherwise. But every increase in yield also raises the income that pays you to wait, and the income you earn today for each unit of interest-rate risk you take is as good as it has been in most of our careers.
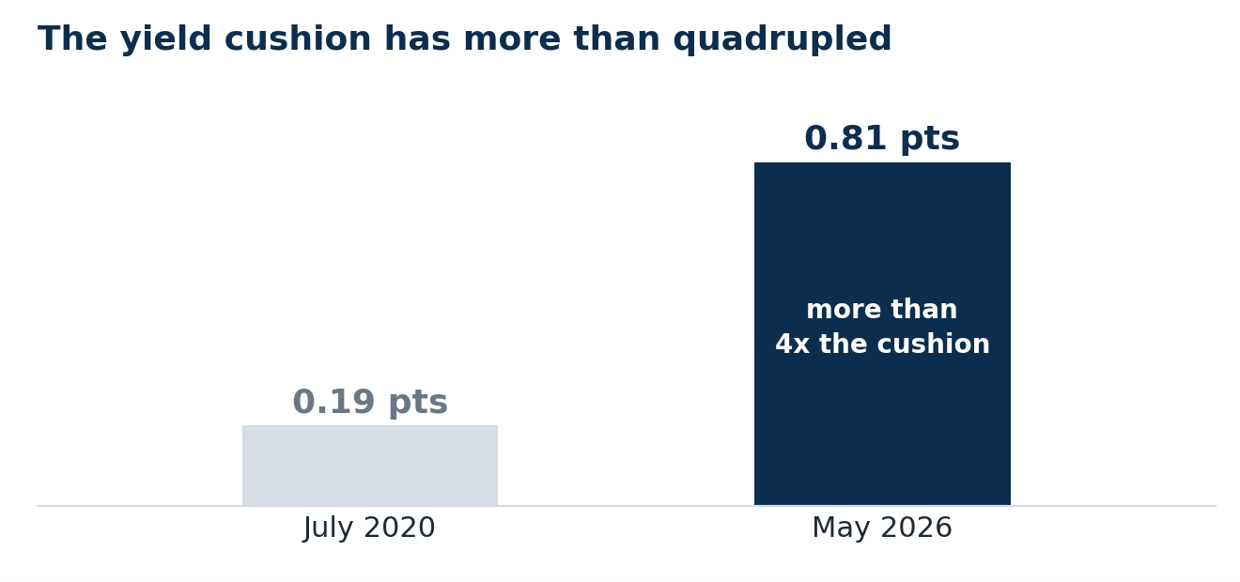
Yield cushion: the estimated rise in yields over one year at which the Bloomberg U.S. Aggregate Bond Index’s total return would fall to zero, based on the index’s yield and duration at the time. Sources: Carson Group (July 2020 estimate); Forbes/Chris Gunster (May 2026 estimate). The index yield has since risen above 5% (Vanguard, September 2026), implying a larger cushion today.
The same logic applies to the nearly $8 trillion sitting in money market funds, a record. Cash got its raise on the 16th, about a quarter of a percent, and it may get one more. But cash is the one asset that never locks in today’s yield; it resets every day, in both directions, and the Fed’s own projections show rates holding from here and eventually coming down. History is consistent on this: once a hiking cycle has ended, the year that followed has generally treated bond investors considerably better than cash investors. Nobody rings a bell at the final hike. The window to do something about cash is while everyone is still arguing about it.
Is the AI boom slowing down?
The weekend before last produced a headline we have not seen before in this cycle: the leaders of the largest AI laboratories publicly agreed that the industry should slow down. One chief executive published an essay arguing that AI companies must “slow the pace” at which they make their most advanced models more capable, so that safety testing can keep up; within hours his chief rival endorsed the idea, and others followed. Markets read “slow down” as “spend less,” and chipmakers and computer-hardware companies fell anywhere from 3% to 11% the following Monday.
We think that reaction confused two very different things. What these executives proposed is pacing the development of new frontier models: adding independent evaluators and safety checkpoints before each leap in capability. Nobody proposed slowing the deployment of AI that already exists. The same essay that called for restraint added that “progress will still seem fast,” and the second executive was explicit that pacing “does not mean stopping.”
In July we gave you a simple test for the health of this investment cycle: watch the spending plans, because the first major cloud provider to cut its budget is the warning shot. By that test, nothing has changed. Not one of the large cloud-computing providers has reduced its plans; spending guidance has been raised repeatedly this year. Published tallies of the largest providers’ own guidance now total roughly $725 billion for 2026, and projections for 2027 compiled from company statements and industry sources range from about $1 trillion to as much as $1.3 trillion. Companies do not talk about restraint in press releases and then commit another quarter-trillion dollars in their financial filings unless the demand is real.
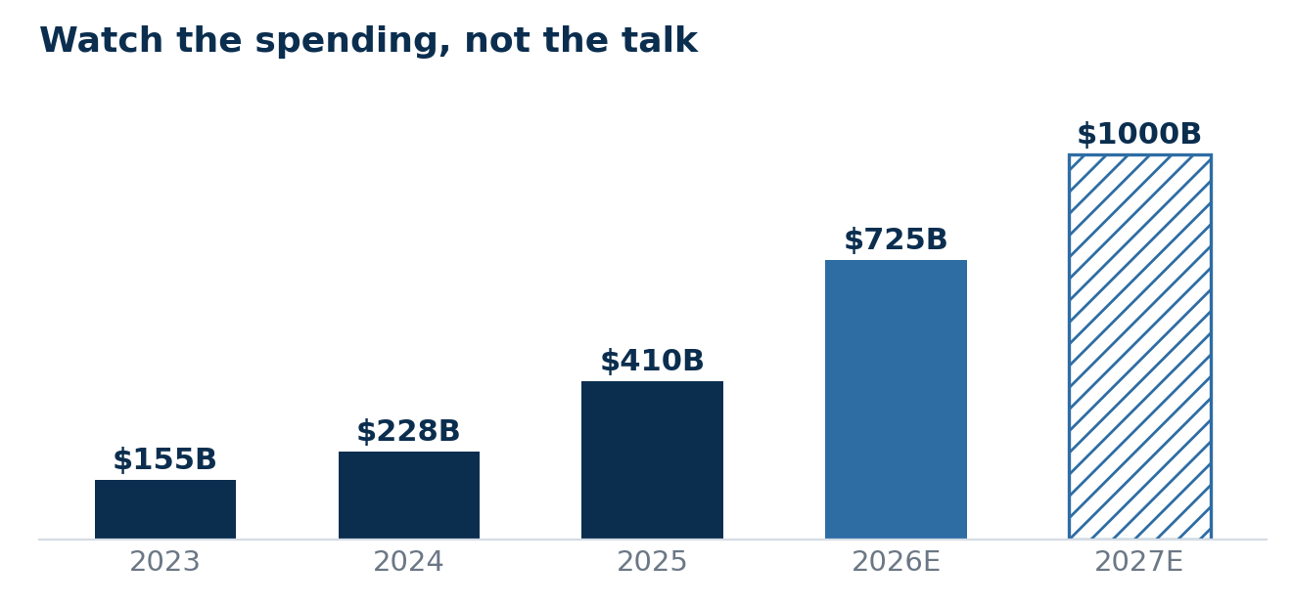
Sources: company filings and guidance; industry estimates for 2026; 2027 reflects early consensus projections. Figures are approximate.
If anything, a deliberate downshift in the race to build new models pushes money toward the parts of the cycle we have been emphasizing since mid-year. When the frontier moves a little slower, the incremental dollar goes to putting existing AI to work: running it, selling it, and powering it. That is the broadening we described in our July webinar: from chips, to data centers, and now to electricity, the power grid, and the industries adopting these tools. A steadier pace arguably extends the life of the cycle rather than shortening it. Our view on stretches like the past two weeks: headline-driven selloffs in a fundamentally healthy buildout are sentiment, not signal. The signal would be a spending cut. There hasn’t been one.
What about the election?
The midterms are November 3, less than six weeks away, and this is the stretch of the calendar when election anxiety usually shows up in markets. The history is worth restating. Since 1962, the S&P 500 has averaged a gain of just 0.3% in the twelve months before a midterm election, and 16.3% in the twelve months after. It has been positive in every single one of those sixteen post-election periods. Markets dislike the uncertainty of the vote and reliably exhale once it passes, whatever the outcome.
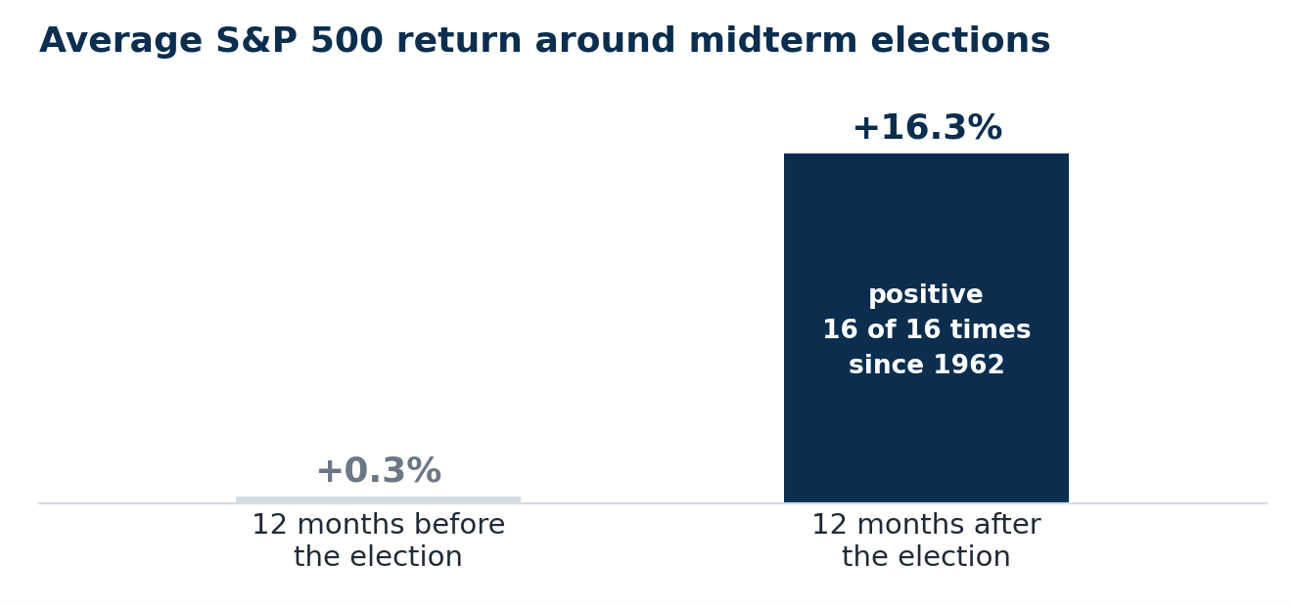
Source: U.S. Bank Asset Management, average S&P 500 returns around midterm elections, 1962–2022. Past performance is no guarantee of future results.
We would add the same point we made in July: this particular cycle carries less suspense than most. Polling and prediction markets have pointed the same direction for months, and nearly every plausible outcome produces a divided or narrowly split government in which little major legislation moves. For markets, that is a familiar and generally comfortable arrangement. It hands the direction of stock prices back to profits, which is where we would want it anyway. One practical note: the Fed’s next meeting falls in late October, days before the vote, which is one more reason to expect quiet from that direction until December.
So what actually matters from here?
Strip away the past two weeks’ noise and the year’s real story is unchanged: 2026 has been paid for by profits. The S&P 500 is up about 12% this year, and over the same stretch the market has actually gotten cheaper: the index’s price relative to expected earnings has fallen since June, and now sits below its five-year average. That only happens when earnings grow faster than prices, and they have. First-quarter profits grew 28.4%, against expectations of about 13% when the quarter began. Second-quarter profits grew roughly 32%, setting aside one-time investment gains at two large companies that pushed the headline figure near 50%. Estimates for the current quarter call for growth near 28%.
Just as encouraging is what analysts have been doing to their forecasts. In a typical quarter, earnings estimates drift about 2% lower as the quarter progresses. This summer, estimates for the third quarter were revised up, the second quarter in a row that has happened, which is rare. And the growth is not narrow: smaller-company stocks, as a group, are outpacing the S&P 500 itself this year. In January we told you we expected 18% to 20% profit growth for 2026 against a consensus near 15%, and we worried we were being aggressive. The year is on track to beat our number, not just the consensus.
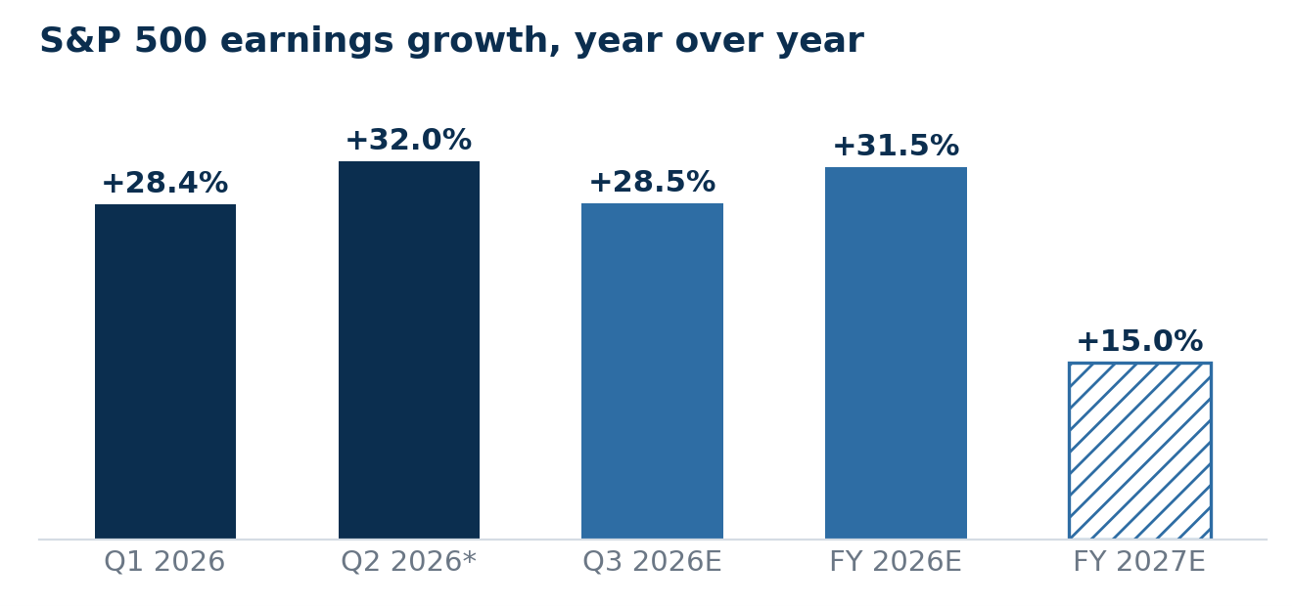
Source: FactSet Earnings Insight, September 2026. Q3 2026, full-year 2026, and full-year 2027 are consensus estimates and subject to change.
This is why the past two weeks’ news does not change our guidance. We continue to favor staying fully invested in equities, with participation across sectors and company sizes rather than concentration in a handful of names. We view today’s yields as a genuine opportunity in high-quality bonds, for the reasons laid out above. We believe risk management continues to earn its keep, with oil back above $100 a barrel for the first time since May and the geopolitical picture unsettled. And we continue to view large cash balances as the most expensive comfort available. How each of these applies to your accounts depends on your plan, which is a conversation for you and your Financial Advisor.
Between now and year-end
The calendar from here: revised GDP figures and the Fed’s preferred inflation reading arrive September 30, the September jobs report on October 2, the next inflation report in mid-October alongside the start of third-quarter earnings season, the Fed’s meeting in late October, and the election November 3. Any of these can move markets for a day or a week. None of them changes the framework: an economy the Fed itself describes as strengthening, inflation trending lower on an annual basis, the largest private investment cycle in history still accelerating, and corporate profits growing at a pace few expected a year ago.
Headlines will keep coming. They always do. Our job, and the reason this commentary exists, is to keep the distinction between what feels urgent and what actually compounds. If the past two weeks raised questions about your own portfolio, your Financial Advisor is the right person to walk through them with you. Every household’s situation is different, and that conversation is what we are here for.
Michael Levitsky, CFA®, CAIA®
Chief Investment Officer, Seventy2 Capital Wealth Management
Sources & Disclosures
All market data as of the morning of September 24, 2026 unless noted. Federal Reserve: FOMC statement, Summary of Economic Projections, and Chair Warsh press conference transcript, September 16, 2026 (unanimous 25 bp increase to 3.75–4.00%; median projections of 2.3% GDP growth in 2026 and 2.4% in 2027, unemployment near 4.1%, PCE inflation of 3.7% in 2026 falling to 2.3% in 2027, and a median federal funds rate of 4.1% at end-2026, unchanged through 2027). CME FedWatch via CNN Business, September 15, 2026 (approximately 92% market-implied probability of a hike ahead of the meeting). Bureau of Labor Statistics: Consumer Price Index, August 2026 (headline 3.4% y/y; core 2.4% y/y, the smallest annual increase since 2021) and Employment Situation, August 2026 (nonfarm payrolls +162,000). Bureau of Economic Analysis: PCE price index, July 2026 (core 3.3% y/y); real GDP (GDPC1) via FRED for decade growth averages. Treasury yields: Federal Reserve Board H.15 via FRED (10-year constant maturity: 5.00% on September 15, 5.01% on September 16, 4.94% on September 17, 4.96% on September 22; average of daily data since 1962 of 5.8%; decade averages of 4.8% for the 1960s, 7.5% for the 1970s, 10.6% for the 1980s, 6.7% for the 1990s, 4.5% for the 2000s, 2.4% for the 2010s, and 3.1% for 2020 to date); Trading Economics and Edward Jones (10-year at 5.11% on September 23, highest since July 2007); Investing.com (30-year at 5.39% on September 23, highest since July 2004); Investrade morning note, September 24, 2026 (10-year 5.15%, 30-year 5.44%, 2-year 4.91%). S&P Global U.S. flash composite PMI, September 2026 (58.4, highest in more than five years) as reported by Edward Jones and Trading Economics. Real yields: 10-year Treasury inflation-indexed constant maturity (DFII10) via FRED, 2.63% on September 22, 2026, the highest since November 2008; 2010–2019 average of 0.42%. Corporate yields: ICE BofA U.S. Corporate Index effective yield via FRED, 5.69% on September 22, 2026, exceeding roughly 91% of daily readings since the series began in 1997. Yield-cushion (breakeven) estimates: Carson Group, May 2024 (Bloomberg U.S. Aggregate breakeven of 0.19 percentage points as of July 2020); Forbes, May 29, 2026 (Aggregate breakeven of 0.81 points; Bloomberg Municipal Index 0.56 points); Vanguard, September 21, 2026 (Aggregate index yield above 5% since August 31, 2026). Trading Economics: S&P 500 near 7,699 on September 24, 2026, approximately 12% above its 2025 year-end close of 6,845.50 (Associated Press). FactSet Earnings Insight: Q1 2026 blended earnings growth of 28.4% with 94% of companies reported (May 21, 2026 edition) versus an estimated 13.0% on March 31; Q2 2026 growth of approximately 50% as reported, and approximately 32% excluding one-time investment gains at two index constituents; Q3 2026 estimated growth of 28.5%, with in-quarter estimate revisions of +1.2% versus a 5-year average of −1.7%; CY2026 estimated growth of 31.5% and CY2027 of 15.0%; forward 12-month P/E of 19.5 versus a 5-year average of 19.8 (September 2026 editions). Estimates are FactSet consensus figures and subject to change. Investment Company Institute: money market fund assets of $7.98 trillion, a record, for the week ended September 2, 2026. Associated Press: Brent crude above $100 per barrel during the week of September 14 for the first time since May 2026; Russell 2000 +17.0% year to date versus S&P 500 +11.9% through September 11, 2026. AI industry statements: public essay and responses from the chief executives of major AI laboratories, September 12–14, 2026, as reported by NBC News, Bloomberg, and CNBC; capital-spending figures reflect published tallies of company guidance and are approximate. U.S. Bank Asset Management: average S&P 500 returns around midterm elections, 1962–2022; historical bond-versus-cash comparisons reference index returns following prior Federal Reserve tightening cycles and are directional. Past performance is no guarantee of future results. Individual advisor recommendations and client portfolios vary. Views expressed are those of the author as of the date above and are subject to change. Investing involves risk, including possible loss of principal. Bond prices fall as interest rates rise.
The S&P 500 Index consists of 500 stocks chosen for market size, liquidity, and industry group representation. It is a market value-weighed index with each stock’s weight in the Index proportionate to its market value.
Wells Fargo Advisors Financial Network did not assist in the preparation of this report, and its accuracy and completeness are not guaranteed. The report herein is not a complete analysis of every material fact in respect to any company, industry or security. The opinions expressed here reflect the judgment of the author as of the date of the report and are subject to change without notice. Any market prices are only indications of market values and are subject to change. The material has been prepared or is distributed solely for information purposes and is not a solicitation or an offer to buy any security or instrument or to participate in any trading strategy. Additional information is available upon request.
Investment products and services are offered through Wells Fargo Advisors Financial Network, LLC (WFAFN), Member SIPC. Seventy2 Capital is a separate entity from WFAFN.